Getting Started with Visual Studio Code? Me too. Let’s see what it takes to get going. This is a bit of a companion piece alongside my .Net Core Series I am writing at the moment. Hopefully as well as .Net Core, I will have a play with writing TypeScript, Rust and maybe C++ inside Visual Studio Code. I might have to focus on the interface in another article as well.
After downloading and installing Visual Studio Code from code.visualstudio.com, or installing using choco install visualstudiocode from the command line, there are few things missing.
It seems that, by default, Code is OOTB ready for JavaScript. But .Net support needs to be installed.
Installing C# Support
From inside Visual Studio Code, press Ctrl + p to bring up the Quick Open bar, and type in ext install csharp. This installs the extension
C# for Visual Studio Code (Details for the extension here). This includes the OmniSharp tooling as well as support for .Net Core (as of version 1.2, RC1 and RC2 versions are no longer supported and this tooling Supports the 1.0.0 release build.), and support for csproj files (which is probably highly in flux, and currently doesn’t work on Linux or OS X, apparently).
Build and Run a Project
Now that we have our environment set up, we can open a folder with a .Net Core Console Application project in it. (If you haven’t already, check out my Getting Started post on creating a new .Net Core application.)
Choose File -> Open Folder... and navigate into or select the folder for your project. This is the one you initialised with the dotnet new command already (didn’t you?).
If you are lucky, you will see a banner at the top of the screen appear suggesting Required assets to build and debug are missing from your project. Add them?.

If so, click Yes and skip to the next step. If not, you will need to initialise this manually.
Initialise manually
Press F1 to bring up the Command Palette. This is where you can exercise commands against Visual Studio Code. A helpful suggestion menu will pop up, but we want to type in tasks.
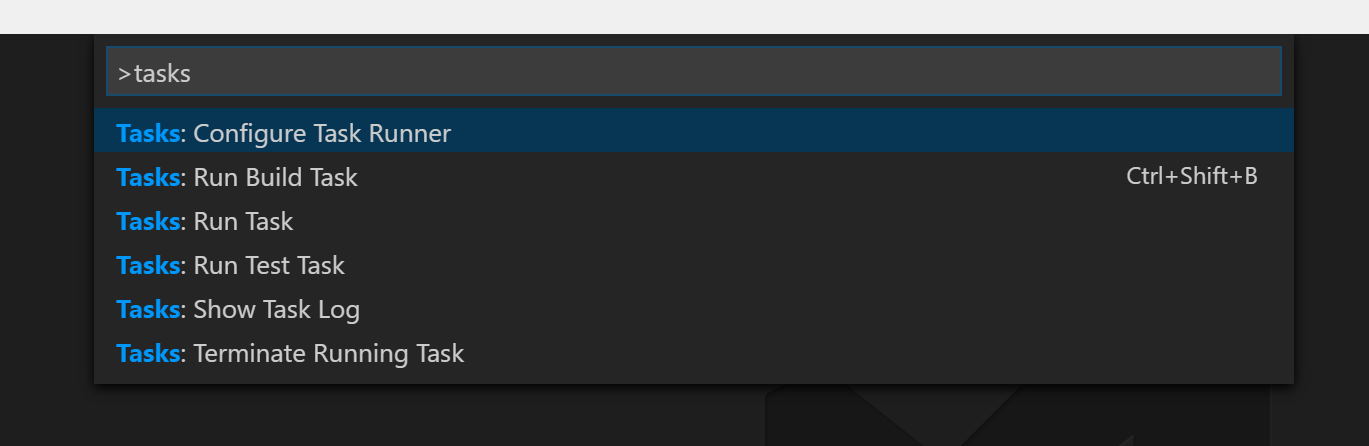
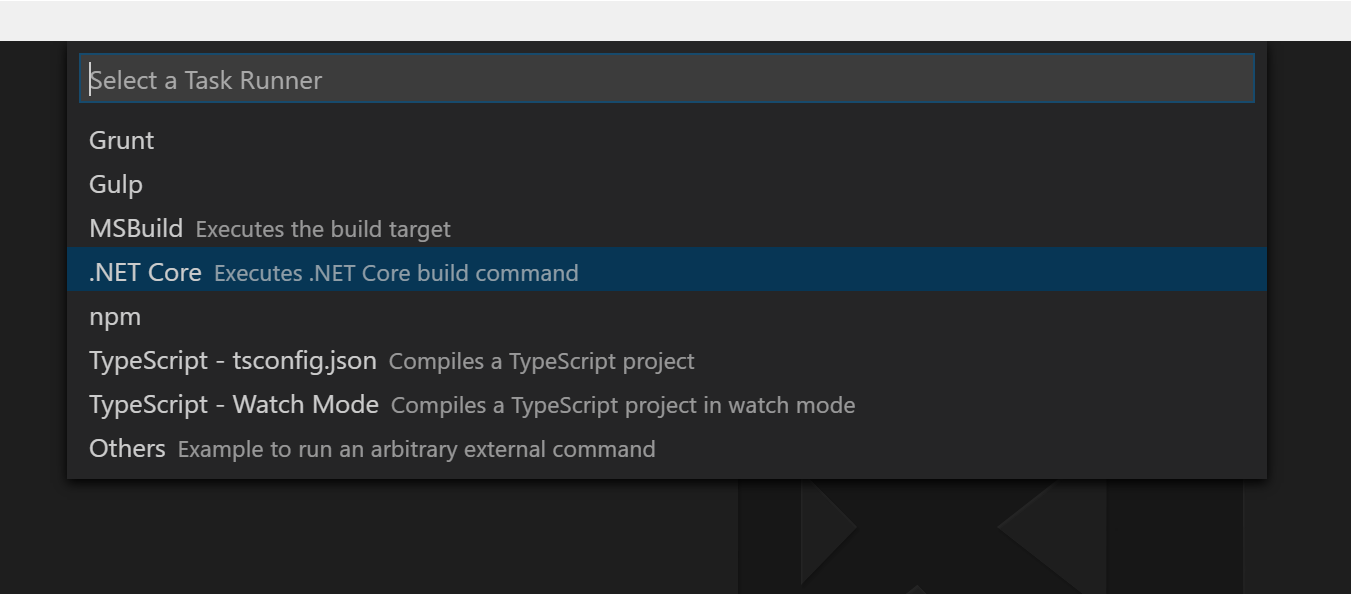
Highlight the Tasks: Configure Task Runner option and press enter. The UI will change to display Select a task runner in the prompt. Select the option .Net Core from the options and press enter.
The next step
Now you should see that we have created a tasks.json file inside a .vscode folder. This configures all the tasks that you can run inside VS code such as build, test, run etc.
To run this task, press Ctrl + p to bring up the Quick Open menu, and type in task . As soon as you add that last space, the hint menu should now show our task build. Either select this and press enter or type in build so that the command bar now says task build and press enter.
Apart from a spinner at the bottom right, there isn’t much to see. We should open the Output window using either Ctrl + Shift + U or from the menu View -> Toggle Output. Now we can see the output produced from our build.
To add a run command, we just need to modify our task runner. Add the following json below the build command:
,
        {
            "taskName": "run",
            "args": [ ],
            "showOutput": "always"
        }
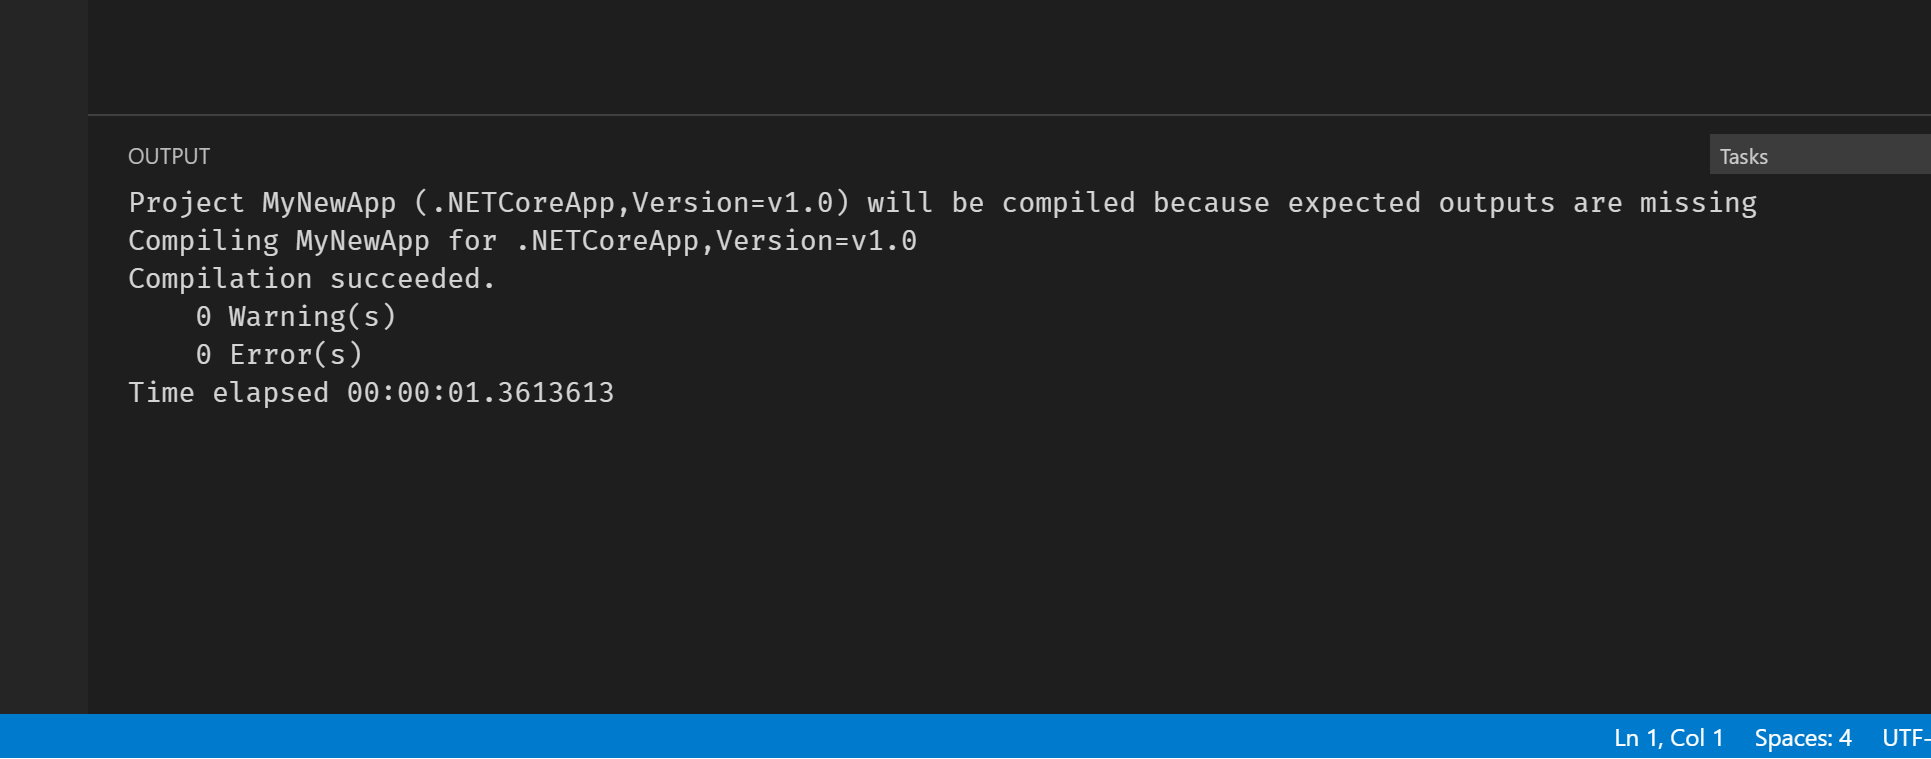
Now use Ctrl + p, type task run and press enter. You should now see the following output in the Output window:
Project MyNewApp (.NETCoreApp,Version=v1.0) will be compiled because inputs were modified
Compiling MyNewApp for .NETCoreApp,Version=v1.0
Compilation succeeded.
    0 Warning(s)
    0 Error(s)
Time elapsed 00:00:01.4849643

Hello World!
Now we have a .Net Core application successfully running inside Visual Studio Code.
Debug
Of course, we probably want to be able to debug as well as run the application, so let’s look at that next.
Switching to debug mode can be done using the Bug icon tab on the left-hand side, by using the menu View -> Debug or by using the shortcut key Ctrl + Shift + D. (Ctrl + Shift + E gets you back to the Explorer View where the files are).

There is a familiar debug play button in the top of this panel. There is a dropdown beside it that says No Configurations. When we press play for the first time, we will see the Command Palette open again with a selection list. Select the .Net Core option and press enter (or just click on it, both work). Now we will have a launch.json file added into the .vscode folder as well.
When we look back at the dropdown beside the green Debugger button we see it has 3 options in it: .NET Core Launch (console), .NET Core Launch (web) and .NET Core Attach. These match the names of the three Configurations in the launch.json file.
One thing we need to change is the path in the program variable.
"program": "${workspaceRoot}/bin/Debug/<target-framework>/<project-name.dll>",
Needs to be replaced with:
"program": "${workspaceRoot}/bin/Debug/netcoreapp1.0/MyNewApp.dll",
With the .NET Core Launch (console) option selected in the Configurations dropdown, press the Debugger green play button.
Two things might happen here, depending on If you used Visual studio to create your project, or if you used the dotnet new command.
Because I used an xproj…
When we pressed play, we might see it successfully produce output similar to the one below.
Loaded 'C:\Program Files\dotnet\shared\Microsoft.NETCore.App\1.0.0\System.Private.CoreLib.ni.dll'. Cannot find or open the symbol file.
WARNING: Could not load symbols for 'MyNewApp.dll'. 'c:\dev\temp\MyNewApp\MyNewApp\src\MyNewApp\bin\Debug\netcoreapp1.0\MyNewApp.pdb' is a Windows PDB. These are not supported by the cross-platform .NET Core debugger.
Loaded 'c:\dev\temp\MyNewApp\MyNewApp\src\MyNewApp\bin\Debug\netcoreapp1.0\MyNewApp.dll'. Cannot find or open the symbol file.
Loaded 'C:\Program Files\dotnet\shared\Microsoft.NETCore.App\1.0.0\System.Runtime.dll'. Cannot find or open the symbol file.
Loaded 'C:\Program Files\dotnet\shared\Microsoft.NETCore.App\1.0.0\mscorlib.dll'. Cannot find or open the symbol file.
Loaded 'C:\Program Files\dotnet\shared\Microsoft.NETCore.App\1.0.0\System.Console.dll'. Cannot find or open the symbol file.
Loaded 'C:\Program Files\dotnet\shared\Microsoft.NETCore.App\1.0.0\System.Threading.dll'. Cannot find or open the symbol file.
Loaded 'C:\Program Files\dotnet\shared\Microsoft.NETCore.App\1.0.0\System.IO.dll'. Cannot find or open the symbol file.
Loaded 'C:\Program Files\dotnet\shared\Microsoft.NETCore.App\1.0.0\System.IO.FileSystem.Primitives.dll'. Cannot find or open the symbol file.
Loaded 'C:\Program Files\dotnet\shared\Microsoft.NETCore.App\1.0.0\System.Text.Encoding.dll'. Cannot find or open the symbol file.
Loaded 'C:\Program Files\dotnet\shared\Microsoft.NETCore.App\1.0.0\System.Text.Encoding.Extensions.dll'. Cannot find or open the symbol file.
Loaded 'C:\Program Files\dotnet\shared\Microsoft.NETCore.App\1.0.0\System.Threading.Tasks.dll'. Cannot find or open the symbol file.
Hello World!
The program 'c:\dev\temp\MyNewApp\MyNewApp\src\MyNewApp\bin\Debug\netcoreapp1.0\MyNewApp.dll' has exited with code 0 (0x00000000).
It turns out that this is WARNING near the start is important:
WARNING: Could not load symbols for 'MyNewApp.dll'. 'c:\dev\temp\MyNewApp\MyNewApp\src\MyNewApp\bin\Debug\netcoreapp1.0\MyNewApp.pdb' is a Windows PDB. These are not supported by the cross-platform .NET Core debugger.
If you don’t actually see this warning in your output, just skip ahead to the next Debug Working section.
If we try to debug at the moment, the breakpoint doesn’t get hit. We are missing a setting in our project.json file. The buildOptions section needs a debugType value of portable added, to correctly produce the right kind of pdb files for debugging with Visual Studio Code. Modify your project.json file as below to add "debugType": "portable" to buildOptions
{
  ...
  "buildOptions": {
    ...
    "debugType": "portable"
  },
  ...
}
Now we can continue and we should no longer see the warning.
Debug Working
When we run the debugger now we should see the following output:
Loaded 'C:\Program Files\dotnet\shared\Microsoft.NETCore.App\1.0.0\System.Private.CoreLib.ni.dll'. Cannot find or open the symbol file.
Loaded 'c:\dev\temp\MyNewApp\MyNewApp\src\MyNewApp\bin\Debug\netcoreapp1.0\MyNewApp.dll'. Symbols loaded.
Loaded 'C:\Program Files\dotnet\shared\Microsoft.NETCore.App\1.0.0\System.Runtime.dll'. Cannot find or open the symbol file.
Loaded 'C:\Program Files\dotnet\shared\Microsoft.NETCore.App\1.0.0\mscorlib.dll'. Cannot find or open the symbol file.
Loaded 'C:\Program Files\dotnet\shared\Microsoft.NETCore.App\1.0.0\System.Console.dll'. Cannot find or open the symbol file.
Loaded 'C:\Program Files\dotnet\shared\Microsoft.NETCore.App\1.0.0\System.Threading.dll'. Cannot find or open the symbol file.
Loaded 'C:\Program Files\dotnet\shared\Microsoft.NETCore.App\1.0.0\System.IO.dll'. Cannot find or open the symbol file.
Loaded 'C:\Program Files\dotnet\shared\Microsoft.NETCore.App\1.0.0\System.IO.FileSystem.Primitives.dll'. Cannot find or open the symbol file.
Loaded 'C:\Program Files\dotnet\shared\Microsoft.NETCore.App\1.0.0\System.Text.Encoding.dll'. Cannot find or open the symbol file.
Loaded 'C:\Program Files\dotnet\shared\Microsoft.NETCore.App\1.0.0\System.Text.Encoding.Extensions.dll'. Cannot find or open the symbol file.
Loaded 'C:\Program Files\dotnet\shared\Microsoft.NETCore.App\1.0.0\System.Threading.Tasks.dll'. Cannot find or open the symbol file.
Hello World!
The program 'c:\dev\temp\MyNewApp\MyNewApp\src\MyNewApp\bin\Debug\netcoreapp1.0\MyNewApp.dll' has exited with code 0 (0x00000000).
As we can see, apart from some issues loading framework symbols, our app has run correctly.
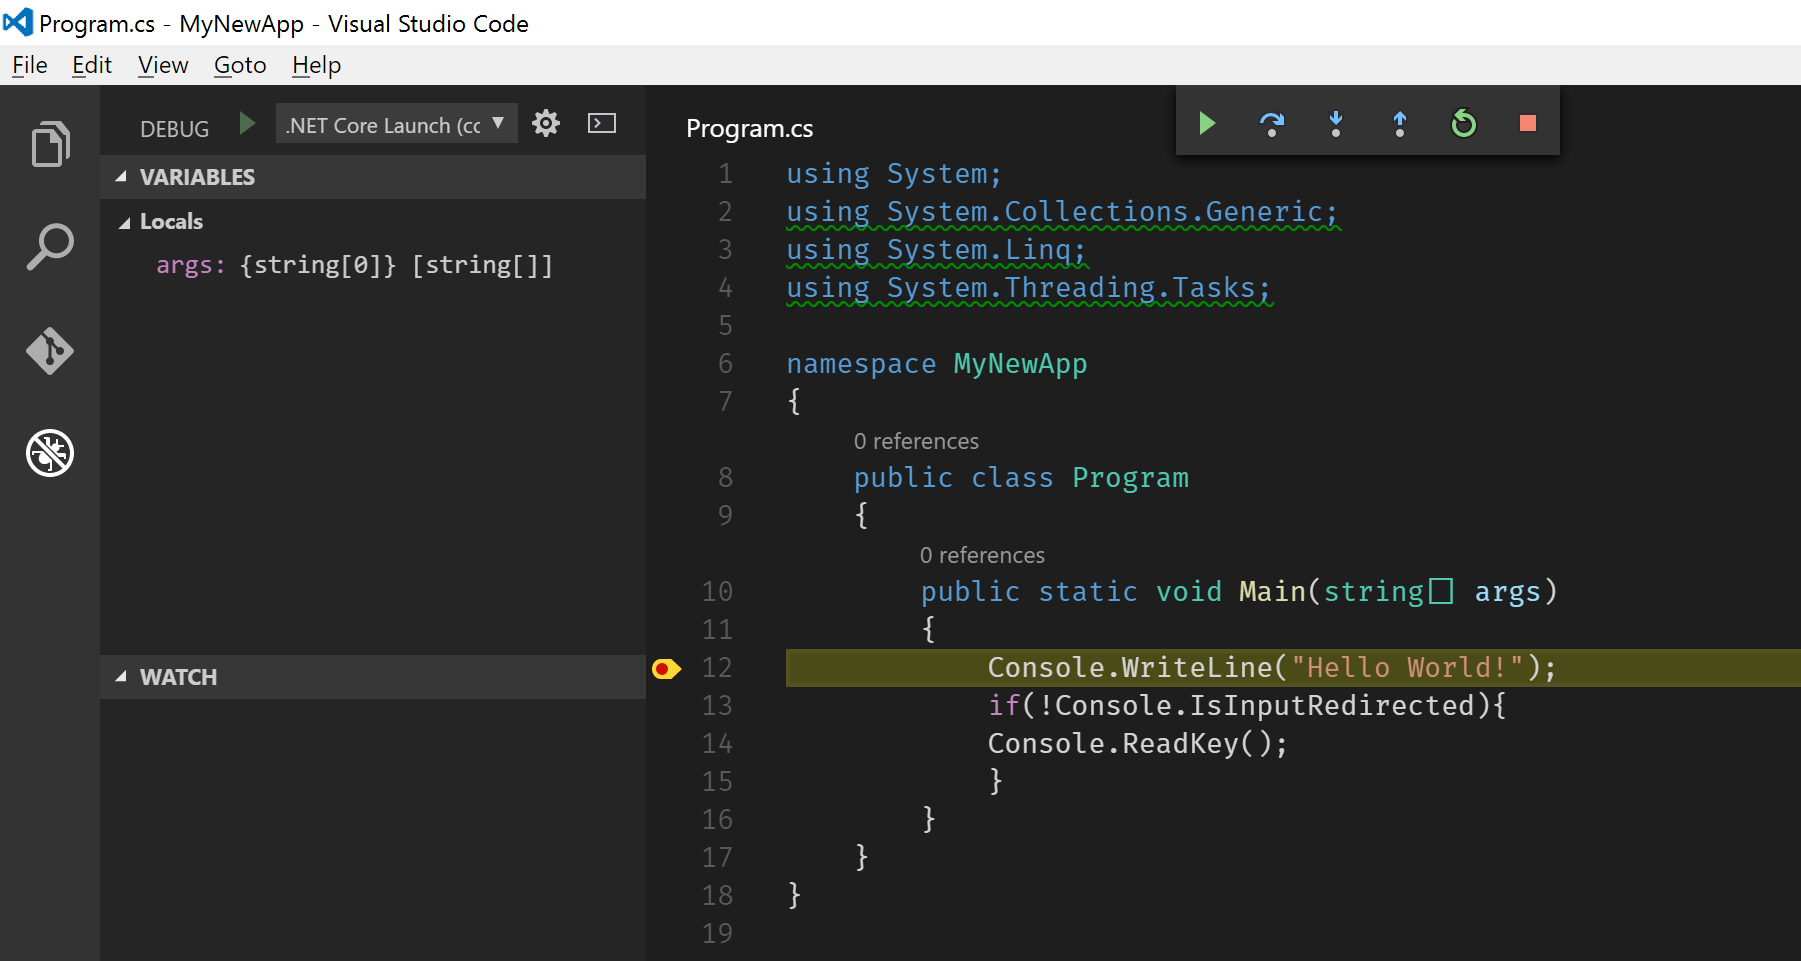
We can now go into our Program.cs file, add a breakpoint, and successfully break inside our code. Yay!
Thanks to CodeClimber for getting me out when I got stuck in places, too.
Solution Level Configuration
Now I want to try something harder. I want to find out if we can get something a bit more like what we are used to in Visual Studio instead, with a Solution-level build and run.
Caveat
I have no idea if this is possible or sensible, I have not had a chance to see what happens when I have multiple projects that depend on each other, and only one open in code. This is an experiment. What will happen?
Open the solution
Choose File -> Open Folder... and navigate into or select the folder for your solution. In my case I have a Visual Studio folder structure like this:
- MyNewApp
- src
- MyNewApp
- Properties
- AssemblyInfo.cs
- MyNewApp.xproj
- Program.cs
- project.json
- project.lock.json
- Properties
- MyNewApp
- global.json
- MyNewApp.sln
- src
(Note: I have excluded some unimportant build artifact files and folders you might see in your directories, such as bin, obj and .vs)
On my machine, I have opened the MyNewApp folder containing the src folder and MyNewApp.sln. What happens next might vary for you if you choose a different location to open.
The first thing that we need to do is set up build tasks. We can start with the default ones and then modify them as needed. As before:
- F1 launch Command Palette
- type tasks
- Select
Tasks: Configure Task Runner
This time from the options we will select msbuild. We want to be able to build and run our solution, rather than use the dotnet CLI on a single project.
As earlier, we should now have a tasks.json file inside a .vscode folder inside the top-level folder you Opened earlier. This time, however, it is set up to run MSBuild.
Now we can run it again as we did last time with Ctrl + p, type task build and Enter.
Failed to launch external program msbuild /property:GenerateFullPaths=true.
spawn msbuild ENOENT
On my machine, it looks like msbuild.exe is not in the path. In my case I am going to add the MSBuild version 14.0 that came with Visual Studio 2015 into my %PATH% environment variable:
C:\Program Files (x86)\MSBuild\14.0\Bin
And restart Visual Studio Code. (It is nice that it remembers the last folder I had open, too.)
One more Ctrl + Shift + B (or ‘Ctrl + p’, task build, Enter) and It looks successful:
Microsoft (R) Build Engine version 14.0.25420.1
Copyright (C) Microsoft Corporation. All rights reserved.
Building the projects in this solution one at a time. To enable parallel build, please add the "/m" switch.
Build started 03/07/2016 16:44:02.
Project "c:\dev\temp\MyNewApp\MyNewApp\MyNewApp.sln" on node 1 (build target(s)).
ValidateSolutionConfiguration:
  Building solution configuration "Debug|Any CPU".
Project "c:\dev\temp\MyNewApp\MyNewApp\MyNewApp.sln" (1) is building "c:\dev\temp\MyNewApp\MyNewApp\src\MyNewApp\MyNewApp.xproj" (2) on node 1 (default targets).
CoreCompile:
  C:\Program Files\dotnet\dotnet.exe build "c:\dev\temp\MyNewApp\MyNewApp\src\MyNewApp" --configuration Debug --no-dependencies
  Project MyNewApp (.NETCoreApp,Version=v1.0) was previously compiled. Skipping compilation.
Done Building Project "c:\dev\temp\MyNewApp\MyNewApp\src\MyNewApp\MyNewApp.xproj" (default targets).
Done Building Project "c:\dev\temp\MyNewApp\MyNewApp\MyNewApp.sln" (build target(s)).
Build succeeded.
    0 Warning(s)
    0 Error(s)
Time Elapsed 00:00:02.08
So now I can build my Visual Studio xproj using MSBuild inside Visual Studio Code.
Debug
Just like before, we can set up Debugging with just a few changes:
- Press the Debugger play button
- The Command Palette will open again
- Select the
.Net Coreoption and press enter - The
launch.jsonfile will be created - Change the path in the program variable.
This time, though, we change the path to be a bit longer since we are in a different root directory.
"program": "${workspaceRoot}/src/MyNewApp/bin/Debug/netcoreapp1.0/MyNewApp.dll",
Now we should be ready to place a breakpoint and debug our code. If you already followed the earlier instructions with the same project, (or you created it using dotnet new), the "debugType": "portable" fix should already be there, otherwise, you can apply that now.
Place a breakpoint into Program.cs and hit the green Debug play button. Alternatively, you can use the familiar F5 shortcut key to start debugging. Success!
Whats Next?
So now we can build and debug our application using Visual Studio Code either at the Solution-level or at the project-level. Going forward we will want to start thinking about tests and running those as well. But I want to go a bit further into how to test using .Net Core from the command-line for a bit before I double back and tackle it in Visual Studio Code.
This has been fun, though probably the longest way to write a blog post. Yes it’s a long one too, so I think I’ll have to look at breaking things down into small achievable chunks if I do this again. Thanks for sticking with me and getting to the end.