
As a remote worker, I need to keep myself honest. This is as much “Make sure I do my hours” as it is “Don’t overwork!”. Anyone who has worked from home or remotely for a period of time understands what I mean completely.
To monitor this, I use Toggl. Toggl is time-tracking as a service, which includes cloud tracking data storage, annotating time against projects and clients, and Client applications for most if not all platforms including web, mobile and desktop. Tracking is even done server side so you can start your timer on one device, and stop it from another. As I say, you can annotate your time with Client, Project, even custom tags.
Toggl has a bunch of advanced time-coding features to produce reports against different projects. If you pay for their starter plan, it can even handle Billable Time. I don’t use any of that. I use their Windows Desktop client (which includes idle time detection to easily clear AFK time) and their online data storage, to hold onto my data for me.
I created this little tool to help me visualise my work patterns as a bit of a heatmap. This was a way for me to answer the question “What are my ‘office hours’” as well as an indication of my work patterns for my team.
The instructions
Exporting Data
Using the Toggl Reports, I can select a time period of data I want to have access to. (Instructions here.) I select a range, say the last year, and then export as CSV.
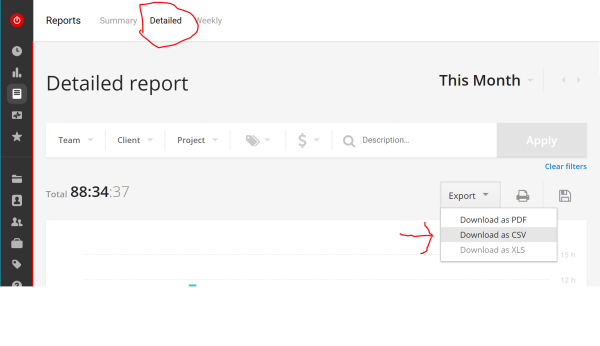
Make sure that you are Exporting a Detailed report. Your file will be named like “Toggl_time_entries_2016-01-01_to_2016-12-31.csv”.
The format of this file should be like this:
User,Email,Client,Project,Task,Description,Billable,Start date,Start time,End date,End time,Duration,Tags,Amount ()
First Last,first.last@email.address,,,,"",No,2016-05-04,10:00:00,2016-05-04,13:00:00,03:00:00,,
First Last,first.last@email.address,,,,"",No,2016-05-04,14:00:00,2016-05-04,16:00:00,02:00:00,,
In theory, anyone could create a CSV in this format and this tool will work just fine for them too. I only use the Start date,Start time,End date,End time,Duration fields anyway.
Process the data
Now that I have a local CSV file, I can process it through my application.
I have made this available as a dotnet tool, so you can easily install it globally and run it from anywhere.
# install globally
dotnet tool install -g TogglHeatmap

# if installed globally, this should just be available on your path
TogglHeatmap <args>

# install into a local folder
dotnet tool install TogglHeatmap --tools-path tools

# if installed into a tools path, you can run it from there.
.\tools\TogglHeatmap <args>
For those new to tools, there is also an update option if newer versions come available, as well as a version parameter if you require a specific version:
dotnet tool install -g TogglHeatmap --version 1.0.0
# update doesn't support version but instead gets the latest
dotnet tool update -g TogglHeatmap
# to replace with a specific version, first uninstall, then install with specific version required specified.
At this stage, the args for the application are as follows (subject to change, check TogglHeatmap --help for latest):
# Start and End dates
TogglHeatmap dataFile.csv 2018-01-01 2018-06-01

# Start and week count
TogglHeatmap dataFile.csv 2018-01-01 26
This should produce a nice report of numbers to the console output:
> TogglHeatmap Toggl_time_entries_2017-08-15_to_2018-08-15.csv 2018-1-1 2018-08-15
Data from 1/1/18 0:00:00 to 15/8/18 0:00:00
First day: Monday
Number of weeks: 32
----
Time,Monday,Tuesday,Wednesday,Thursday,Friday,Saturday,Sunday
00:00,0,13,0,11,0,0,0
00:30,0,8,0,8,0,0,0
01:00,0,4,0,5,0,0,0
01:30,0,2,0,2,0,0,0
02:00,0,0,0,0,0,0,0
02:30,0,0,0,0,0,0,0
03:00,0,0,0,0,0,0,0
03:30,0,0,0,0,0,0,0
04:00,0,0,0,0,0,0,0
04:30,0,0,0,0,0,0,0
05:00,0,0,0,0,0,0,0
05:30,0,0,0,0,0,0,0
06:00,0,0,0,0,0,0,0
06:30,0,0,0,0,0,0,0
07:00,0,0,0,0,0,0,0
07:30,0,0,4,0,0,0,0
08:00,0,0,5,3,4,0,0
08:30,3,5,10,7,6,0,0
09:00,4,10,12,13,6,0,0
09:30,8,17,16,18,10,0,0
10:00,19,22,27,23,26,0,0
10:30,24,20,27,24,23,0,0
11:00,24,21,28,28,22,0,1
11:30,24,20,29,28,22,0,0
12:00,23,22,28,27,21,0,0
12:30,21,20,27,27,21,0,0
13:00,23,20,25,23,21,0,0
13:30,23,21,26,23,23,0,0
14:00,23,23,28,24,22,0,0
14:30,24,24,25,25,24,0,0
15:00,22,25,27,23,25,0,0
15:30,22,24,26,26,24,0,0
16:00,23,27,27,26,24,0,0
16:30,22,25,27,24,24,0,0
17:00,19,21,20,21,16,0,0
17:30,11,18,16,16,7,0,0
18:00,11,19,10,13,6,0,0
18:30,9,13,3,12,5,0,0
19:00,3,9,2,6,5,0,0
19:30,2,9,4,3,3,0,0
20:00,7,4,9,5,2,0,0
20:30,8,7,12,6,2,0,0
21:00,11,6,15,6,2,0,0
21:30,22,6,18,5,1,0,1
22:00,22,4,21,3,1,0,1
22:30,19,1,21,1,1,0,1
23:00,18,1,19,0,0,0,0
23:30,13,1,14,0,0,0,0
----

Copy the data above into a CSV file to make it pretty in a spreadsheet
We have our heatmap data, and we can copy and save it to a CSV file. Now we can do whatever makes sense to us to present it.
Spreadsheet UI
For instance, you may want to pull it into a Google Sheet. This should be similar for Excel if that is your office suite of choice instead.
First, create a new Sheet.
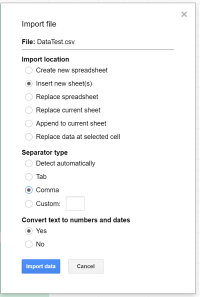
Take your CSV file of data you created before from the output. You can import that file into Sheets. Simply go to File->Import... menu, and in the popup and locate your file. Once you have located, uploaded and selected your file, you will get the second dialogue. In this dialogue Select where you want the data to go (for example Insert new sheet, or Replace current sheet) and choose Comma for the Separator type.
Once imported, you may want to conditionally colour the numbers. Select cell range from B2 to H49, Select Format->Conditional Formatting... from the menu. In the sidebar that opens on the right, select the Color scale from the tab at the top, ensure Apply to range is set to B2:H49 as selected before, And select the colours you want from the drop-down labelled Preview.
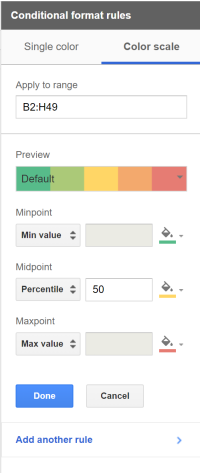
Click done to finish and enjoy your pretty picture.
Analysis
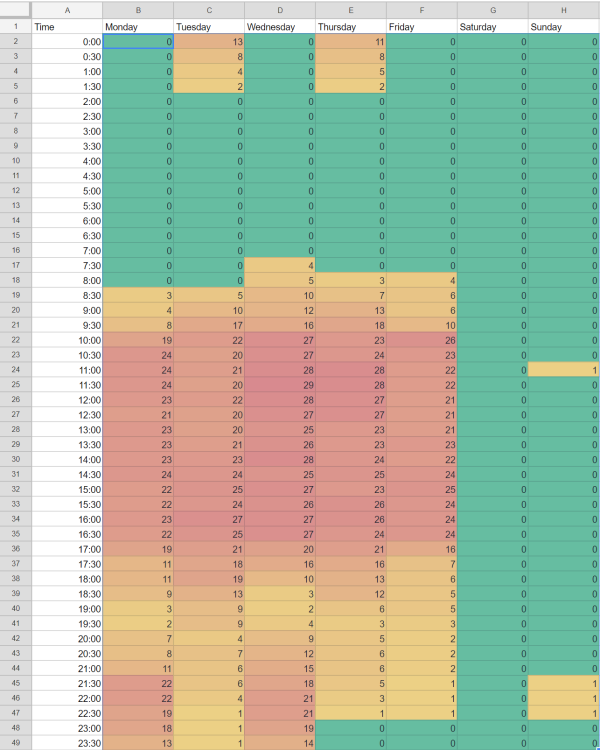
For me, this ‘graph’ above gives me interesting insights, such as that my day is 10am-5pm then Monday nights and Wednesday nights 9:30 pm until 1 am, But I am really working anytime from 8:30 am till midnight early in the week, 8 am till 11 pm later in the week. There is also no correlation for when I take lunch, but dinner break is some time between 6:30 pm and 8 pm.
These insights are easier to presume from the visual graph, and I can compare these graphs for different periods of the year to see how these insights change.
Conclusion
I’ve got a bunch of ideas to improve the CLI interface for TogglHeatmap. Including just using all the data as the date range without requiring entry. It might happen at some point, who knows? One of my other projects is working on an args parser library so this might be just another testbed for that at some point.
The source code is on Github at github.com/csMACnz/TogglHeatmap. Issues welcome.
Hopefully, someone other than me finds this useful. If not, I have found it useful to document the evolution of my working hours.